VisionSOM-STM32MP1 simple swipe demo
From SomLabs Wiki
VisionSOM-STM32MP1 simple swipe demo
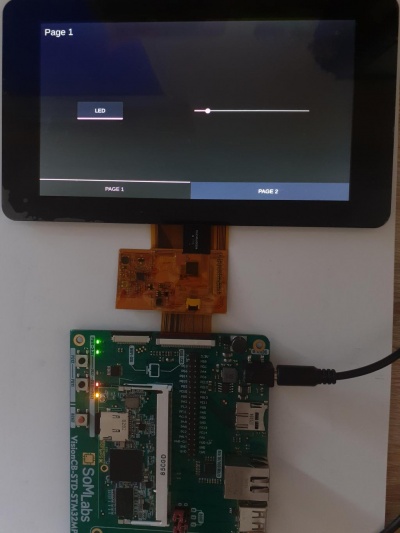
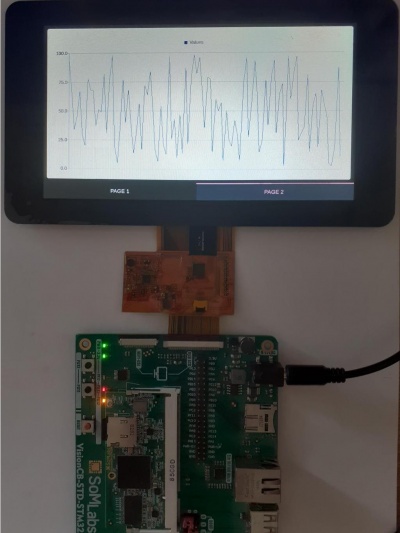
This project is a simple demo presenting the Qt application with swipe view and line chart. It was tested on the VisionSOM-STM32MP1 module with VisionCB-STM32MP1-STD and the SL-TFT7-TP-800-480-P RGB display. All project files man be downloaded here: SwipeDemo.zip.
OpenSTLinux configuration
This example requires the qtcharts module to be included during system build. It may be added to the recipes-st/images/st-image-weston.bbappend file in the meta-somlabs layer.
inherit populate_sdk_qt5

IMAGE_INSTALL += " \
    qtbase-dev \
    qtbase-mkspecs \
    qtbase-tools \
    qtdeclarative-qmlplugins \
    qtquickcontrols2-qmlplugins \
    qtwayland \
    gstreamer1.0 \
    gstreamer1.0-plugins-good \
    qtcharts \
"
GUI implementation
The GUI is implemented in the three files described below. The main GUI file: main.qml, defines the application window with two pages. It also contains the implementation of necessary functions that are separated from the ui.qml files.
import QtQuick 2.9
import QtQuick.Controls 2.2

ApplicationWindow {
    visible: true
    visibility: "FullScreen"
    title: qsTr("Tabs")

    SwipeView {
        id: swipeView
        anchors.fill: parent
        currentIndex: tabBar.currentIndex

        Page1Form {
            button.onCheckedChanged: ledHandler.setEnabled(button.checked)
            slider.onValueChanged: ledHandler.setBrightness(slider.value)
        }

        Page2Form {
            id: chartPage
            Connections {
                target: pointGenerator
                onDoAddSample: {
                    chartPage.addPoint(value)
                }
            }

            function addPoint(value) {
                dataSeries.append(numberOfPoints, value)

                if (dataSeries.count > maxNumberOfPoints) {
                    dataSeries.remove(0)
                }

                dataSeries.xAxis.min += 1
                dataSeries.xAxis.max += 1
                numberOfPoints += 1
            }
        }
    }

    footer: TabBar {
        id: tabBar
        currentIndex: swipeView.currentIndex

        TabButton {
            text: qsTr("Page 1")
        }
        TabButton {
            text: qsTr("Page 2")
        }
    }
}
The Page1Form.ui.qml file contains the first application page description. It defines a checkable button and a slited. Both for LEDs controlling.
import QtQuick 2.9
import QtQuick.Controls 2.2

Page {
    property alias button: button
    property alias slider: slider

    header: Label {
        text: qsTr("Page 1")
        font.pixelSize: Qt.application.font.pixelSize * 2
        padding: 10
    }

    Button {
        id: button
        y: 110
        width: 120
        height: 60
        text: qsTr("LED")
        anchors.left: parent.left
        anchors.leftMargin: 100
        anchors.verticalCenter: parent.verticalCenter
        checkable: true
    }

    Slider {
        id: slider
        x: 260
        y: 110
        width: 300
        anchors.right: parent.right
        anchors.rightMargin: 100
        anchors.verticalCenterOffset: 0
        anchors.verticalCenter: parent.verticalCenter
        from: 0
        to: 100
        stepSize: 10
        value: 0
    }
}
The Page2Form.ui.qml file contains the second application page description. It defines a ChartView with a line chart and two axes. The line chart has maximum of 100 points. The function responsible for dynamic points adding is implemented in the main.qml file.
import QtQuick 2.9
import QtQuick.Controls 2.2
import QtCharts 2.0

ChartView {
    antialiasing: true
    animationOptions: ChartView.NoAnimation

    property int numberOfPoints: 0
    property int maxNumberOfPoints: 100
    property alias dataSeries: dataSeries

    LineSeries {
        id: dataSeries
        name: "Values"
        useOpenGL: true

        property alias xAxis: xAxis

        axisX: ValueAxis {
            id: xAxis
            min: -1 * maxNumberOfPoints
            max: 0
            visible: false
        }
        axisY: ValueAxis {
            min: 0
            max: 100
        }
    }
}
Application logic
The project contains the LedHandler class responsible for handling the events generated by the button and slider. It simply uses /sys/class/leds filed for brightness control.
#ifndef LEDHANDLER_H
#define LEDHANDLER_H

#include <QObject>
#include <QFile>

class LedHandler : public QObject
{
    Q_OBJECT
public:
    explicit LedHandler(QObject *parent = nullptr);

signals:

public slots:
    void setEnabled(bool enabled);
    void setBrightness(unsigned int brightness);

private:
    QFile* gpioLedFile;
    QFile* pwmLedFile;
};

#endif // LEDHANDLER_H
#include "ledhandler.h"
#include <QDebug>

LedHandler::LedHandler(QObject *parent) : QObject(parent)
{
    this->gpioLedFile = new QFile("/sys/class/leds/led3/brightness");
    this->gpioLedFile->open(QIODevice::WriteOnly);
    this->pwmLedFile = new QFile("/sys/class/leds/led2/brightness");
    this->pwmLedFile->open(QIODevice::WriteOnly);
}

void LedHandler::setEnabled(bool enabled)
{
    qDebug() << "Enabled" << enabled;

    if (enabled)
        this->gpioLedFile->write("1");
    else
        this->gpioLedFile->write("0");

    this->gpioLedFile->flush();
}

void LedHandler::setBrightness(unsigned int brightness)
{
    qDebug() << "Brightness" << brightness;
    this->pwmLedFile->write(QString::number(brightness).toLatin1());
    this->pwmLedFile->flush();
}
The second class added in this project is the PointGenerator class. It simply uses a QTimer for sending a signal to the chart every one second.
#ifndef POINTGENERATOR_H
#define POINTGENERATOR_H

#include <QObject>
#include <QTimer>

class PointGenerator : public QObject
{
    Q_OBJECT
public:
    explicit PointGenerator(QObject *parent = nullptr);

signals:
    void doAddSample(int value);

public slots:
    void timeout();

private:
    QTimer* timer;
};

#endif // POINTGENERATOR_H
#include "pointgenerator.h"
#include <QDateTime>

PointGenerator::PointGenerator(QObject *parent) : QObject(parent)
{
    this->timer = new QTimer();
    this->timer->setSingleShot(false);
    this->timer->start(1000);
    connect(this->timer, SIGNAL(timeout()), this, SLOT(timeout()));

    qsrand(QDateTime::currentMSecsSinceEpoch() / 1000);
}

void PointGenerator::timeout()
{
    emit this->doAddSample(qrand() % 100);
}
Finally the main.cpp file contains the main application function that creates the application and connects the necessary objects with the GUI.
#include <QApplication>
#include <QQmlApplicationEngine>
#include <QQmlContext>
#include "ledhandler.h"
#include "pointgenerator.h"

int main(int argc, char *argv[])
{
    QCoreApplication::setAttribute(Qt::AA_EnableHighDpiScaling);

    QApplication app(argc, argv);

    LedHandler ledHandler;
    ledHandler.setBrightness(0);
    ledHandler.setEnabled(false);

    PointGenerator pointGenerator;

    QQmlApplicationEngine engine;

    engine.rootContext()->setContextProperty("ledHandler", &ledHandler);
    engine.rootContext()->setContextProperty("pointGenerator", &pointGenerator);

    engine.load(QUrl(QStringLiteral("qrc:/main.qml")));
    if (engine.rootObjects().isEmpty())
        return -1;

    return app.exec();
}


